![[Deprecated]](figures/lifecycle-deprecated.svg) Soft-deprecated in favour of
Soft-deprecated in favour of
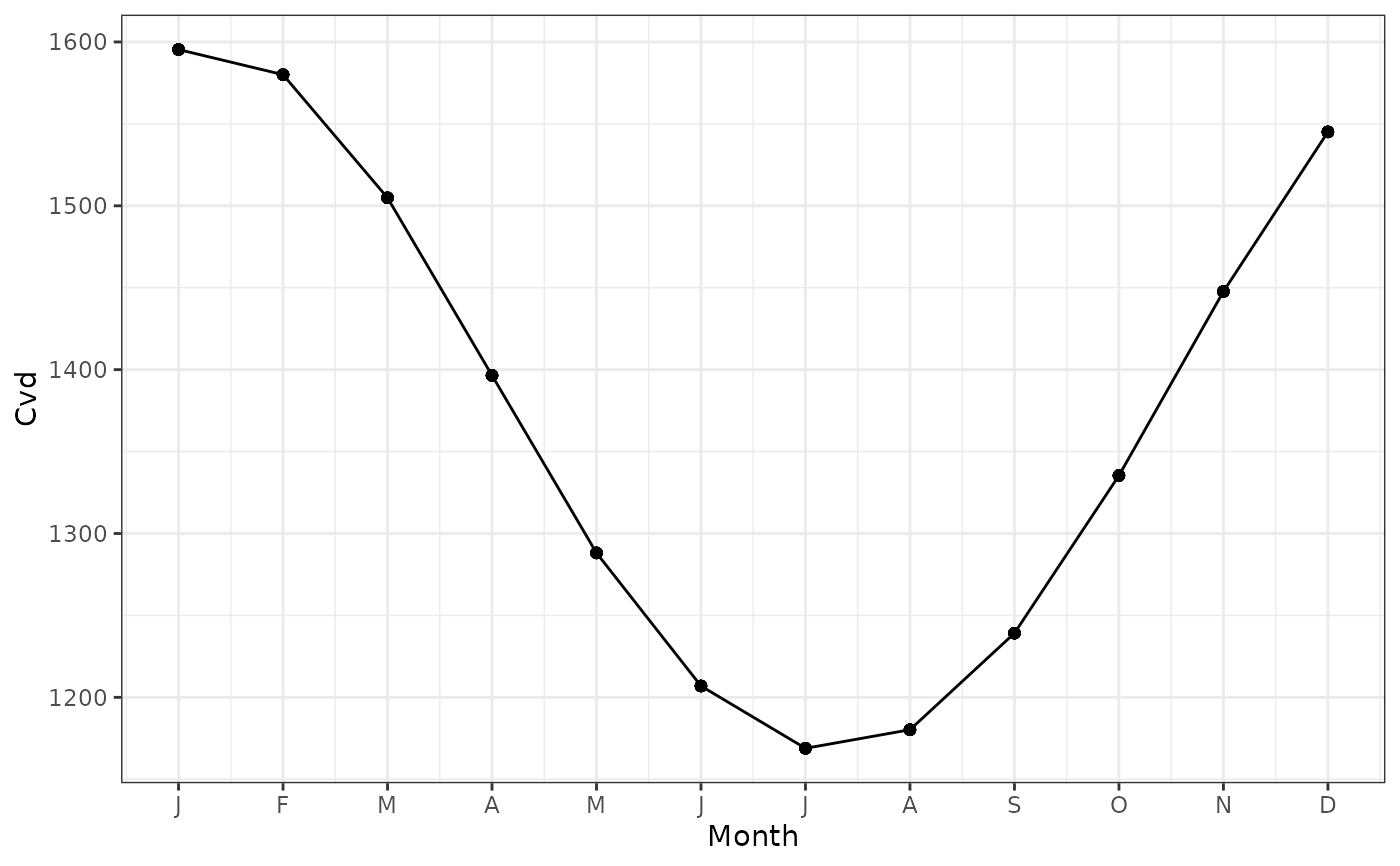
autoplot.Cosinor(), which returns a ggplot object you can extend with
+. The base R plot below still works.
Usage
# S3 method for class 'Cosinor'
plot(x, ...)
Arguments
- x
a
Cosinorobject produced bycosinor()- ...
additional arguments passed to the sinusoid plot.
Value
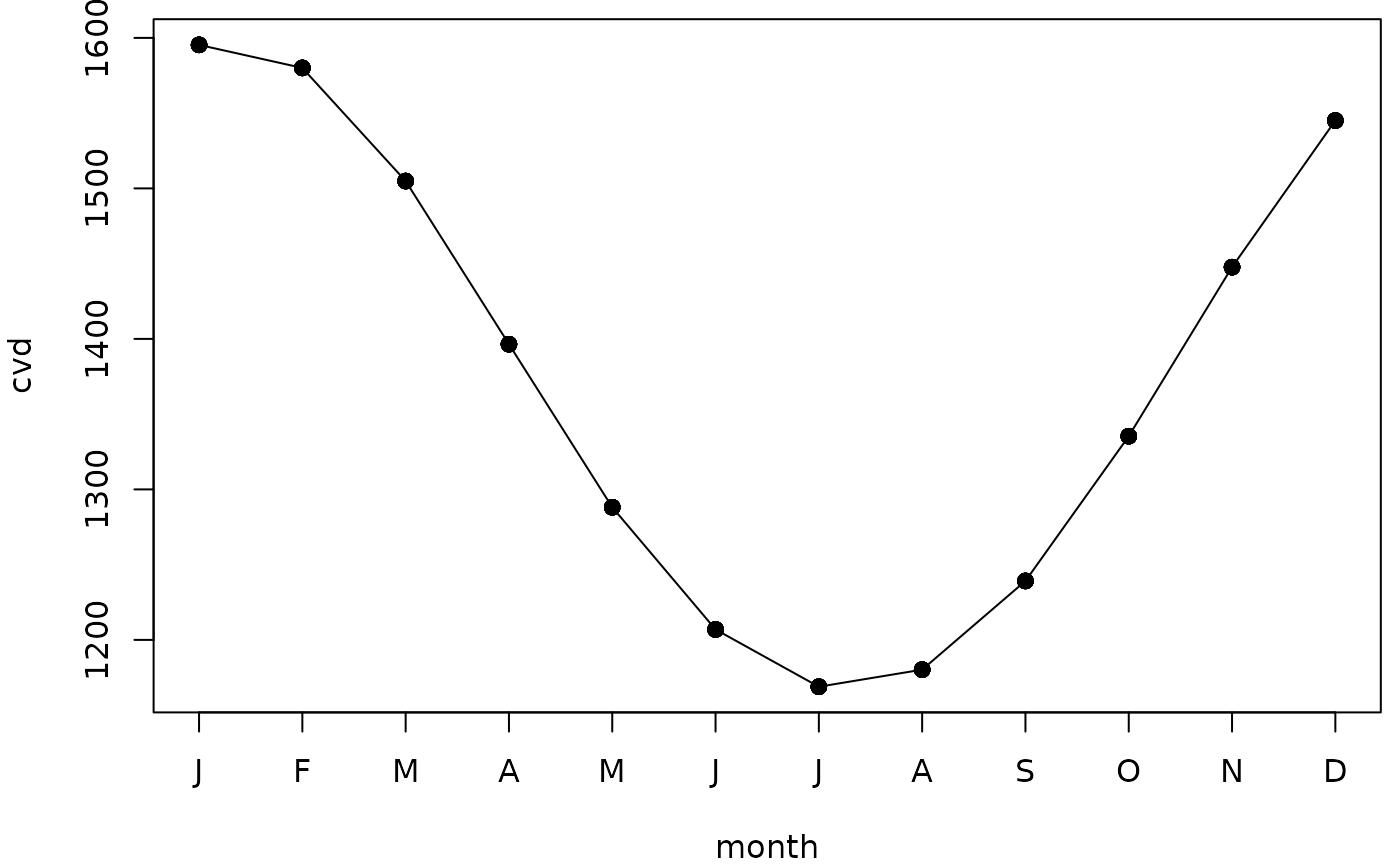
connected line plot of fitted sinusoid object produced by cosinor.
Details
The code produces the fitted sinusoid based on the intercept and sinusoid. The y-axis is on the scale of probability if the link function is "logit" or "cloglog". If the analysis was based on monthly data then month is shown on the x-axis. If the analysis was based on daily data then time is shown on the x-axis.
Author
Adrian Barnett a.barnett@qut.edu.au
Examples
## cardiovascular disease data (offset based on number of days in...
## ...the month scaled to an average month length)
res <- cosinor(
  cvd ~ 1,
  date = 'month',
  data = CVD,
  type = 'monthly',
  family = poisson(),
  offsetmonth = TRUE
  )
# Recommended:
autoplot(res)

# Still works, but deprecated:
plot(res)
# Still works, but deprecated:
plot(res)