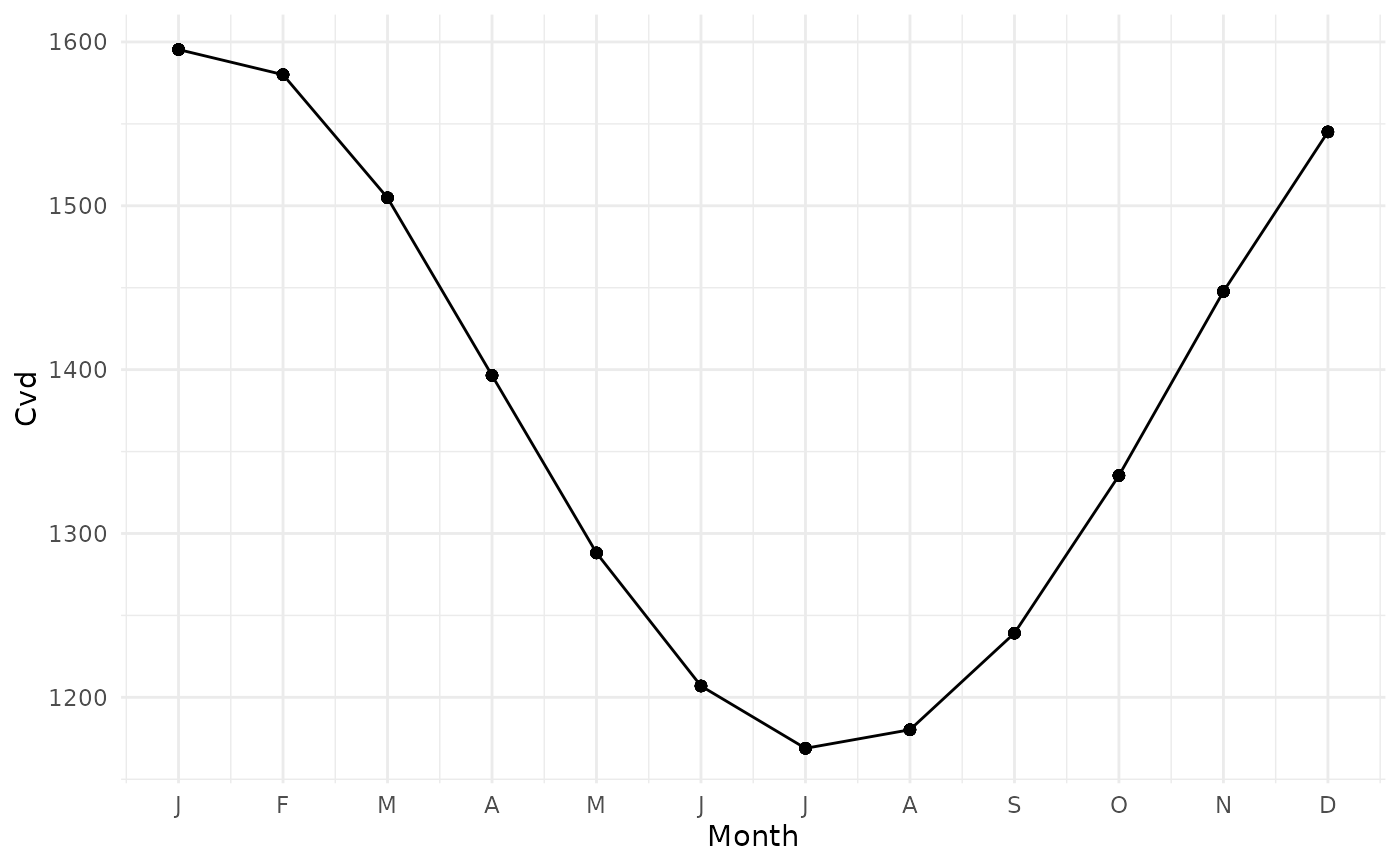
Returns a ggplot of the fitted sinusoid. The y-axis is on the
probability scale for logit and cloglog link functions; the
x-axis switches between month, year, and hour depending on the
type of the model.
Usage
# S3 method for class 'Cosinor'
autoplot(object, ...)
Arguments
- object
a
Cosinorobject produced bycosinor().- ...
unused, for S3 generic compatibility.
Examples
res <- cosinor(
cvd ~ 1,
date = "month",
data = CVD,
type = "monthly",
family = poisson(),
offsetmonth = TRUE
)
autoplot(res)
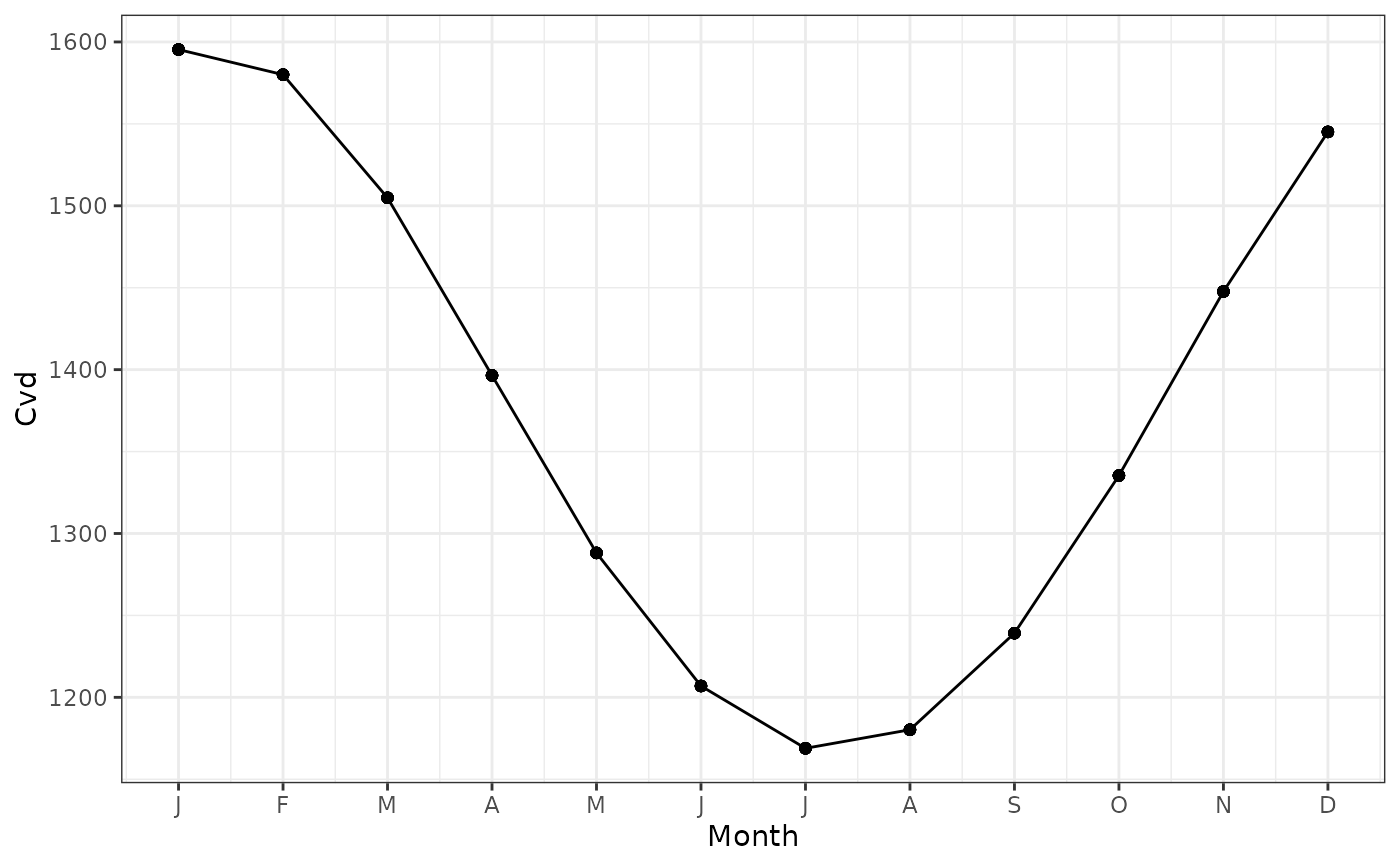 autoplot(res) + ggplot2::theme_minimal()