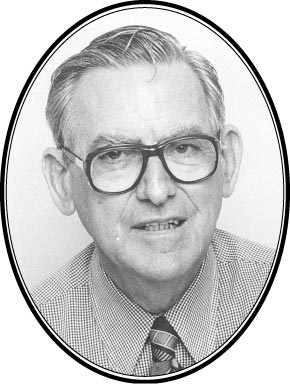
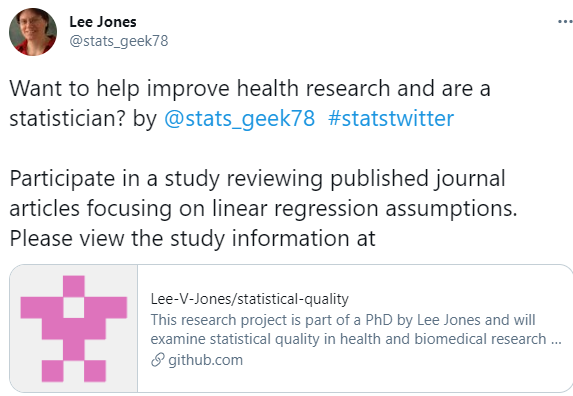
layout: true --- name: xaringan-title class: inverse, left, middle # .center[Bad statistics in health and medical research] ## .center[Lancaster Lecture] ### .center[Adrian Barnett, Queensland University of Technology] #### .center[24 March 2021] [<svg xmlns="http://www.w3.org/2000/svg" viewBox="0 0 512 512" class="rfa" style="height:0.75em;fill:currentColor;position:relative;"><path d="M459.37 151.716c.325 4.548.325 9.097.325 13.645 0 138.72-105.583 298.558-298.558 298.558-59.452 0-114.68-17.219-161.137-47.106 8.447.974 16.568 1.299 25.34 1.299 49.055 0 94.213-16.568 130.274-44.832-46.132-.975-84.792-31.188-98.112-72.772 6.498.974 12.995 1.624 19.818 1.624 9.421 0 18.843-1.3 27.614-3.573-48.081-9.747-84.143-51.98-84.143-102.985v-1.299c13.969 7.797 30.214 12.67 47.431 13.319-28.264-18.843-46.781-51.005-46.781-87.391 0-19.492 5.197-37.36 14.294-52.954 51.655 63.675 129.3 105.258 216.365 109.807-1.624-7.797-2.599-15.918-2.599-24.04 0-57.828 46.782-104.934 104.934-104.934 30.213 0 57.502 12.67 76.67 33.137 23.715-4.548 46.456-13.32 66.599-25.34-7.798 24.366-24.366 44.833-46.132 57.827 21.117-2.273 41.584-8.122 60.426-16.243-14.292 20.791-32.161 39.308-52.628 54.253z"/></svg> @aidybarnett](http://twitter.com/aidybarnett) [<svg xmlns="http://www.w3.org/2000/svg" viewBox="0 0 496 512" class="rfa" style="height:0.75em;fill:currentColor;position:relative;"><path d="M165.9 397.4c0 2-2.3 3.6-5.2 3.6-3.3.3-5.6-1.3-5.6-3.6 0-2 2.3-3.6 5.2-3.6 3-.3 5.6 1.3 5.6 3.6zm-31.1-4.5c-.7 2 1.3 4.3 4.3 4.9 2.6 1 5.6 0 6.2-2s-1.3-4.3-4.3-5.2c-2.6-.7-5.5.3-6.2 2.3zm44.2-1.7c-2.9.7-4.9 2.6-4.6 4.9.3 2 2.9 3.3 5.9 2.6 2.9-.7 4.9-2.6 4.6-4.6-.3-1.9-3-3.2-5.9-2.9zM244.8 8C106.1 8 0 113.3 0 252c0 110.9 69.8 205.8 169.5 239.2 12.8 2.3 17.3-5.6 17.3-12.1 0-6.2-.3-40.4-.3-61.4 0 0-70 15-84.7-29.8 0 0-11.4-29.1-27.8-36.6 0 0-22.9-15.7 1.6-15.4 0 0 24.9 2 38.6 25.8 21.9 38.6 58.6 27.5 72.9 20.9 2.3-16 8.8-27.1 16-33.7-55.9-6.2-112.3-14.3-112.3-110.5 0-27.5 7.6-41.3 23.6-58.9-2.6-6.5-11.1-33.3 2.6-67.9 20.9-6.5 69 27 69 27 20-5.6 41.5-8.5 62.8-8.5s42.8 2.9 62.8 8.5c0 0 48.1-33.6 69-27 13.7 34.7 5.2 61.4 2.6 67.9 16 17.7 25.8 31.5 25.8 58.9 0 96.5-58.9 104.2-114.8 110.5 9.2 7.9 17 22.9 17 46.4 0 33.7-.3 75.4-.3 83.6 0 6.5 4.6 14.4 17.3 12.1C428.2 457.8 496 362.9 496 252 496 113.3 383.5 8 244.8 8zM97.2 352.9c-1.3 1-1 3.3.7 5.2 1.6 1.6 3.9 2.3 5.2 1 1.3-1 1-3.3-.7-5.2-1.6-1.6-3.9-2.3-5.2-1zm-10.8-8.1c-.7 1.3.3 2.9 2.3 3.9 1.6 1 3.6.7 4.3-.7.7-1.3-.3-2.9-2.3-3.9-2-.6-3.6-.3-4.3.7zm32.4 35.6c-1.6 1.3-1 4.3 1.3 6.2 2.3 2.3 5.2 2.6 6.5 1 1.3-1.3.7-4.3-1.3-6.2-2.2-2.3-5.2-2.6-6.5-1zm-11.4-14.7c-1.6 1-1.6 3.6 0 5.9 1.6 2.3 4.3 3.3 5.6 2.3 1.6-1.3 1.6-3.9 0-6.2-1.4-2.3-4-3.3-5.6-2z"/></svg> @agbarnett](http://github.com/agbarnett) [<svg xmlns="http://www.w3.org/2000/svg" viewBox="0 0 512 512" class="rfa" style="height:0.75em;fill:currentColor;position:relative;"><path d="M172.2 226.8c-14.6-2.9-28.2 8.9-28.2 23.8V301c0 10.2 7.1 18.4 16.7 22 18.2 6.8 31.3 24.4 31.3 45 0 26.5-21.5 48-48 48s-48-21.5-48-48V120c0-13.3-10.7-24-24-24H24c-13.3 0-24 10.7-24 24v248c0 89.5 82.1 160.2 175 140.7 54.4-11.4 98.3-55.4 109.7-109.7 17.4-82.9-37-157.2-112.5-172.2zM209 0c-9.2-.5-17 6.8-17 16v31.6c0 8.5 6.6 15.5 15 15.9 129.4 7 233.4 112 240.9 241.5.5 8.4 7.5 15 15.9 15h32.1c9.2 0 16.5-7.8 16-17C503.4 139.8 372.2 8.6 209 0zm.3 96c-9.3-.7-17.3 6.7-17.3 16.1v32.1c0 8.4 6.5 15.3 14.8 15.9 76.8 6.3 138 68.2 144.9 145.2.8 8.3 7.6 14.7 15.9 14.7h32.2c9.3 0 16.8-8 16.1-17.3-8.4-110.1-96.5-198.2-206.6-206.7z"/></svg> Median Watch](https://medianwatch.netlify.app) [<svg xmlns="http://www.w3.org/2000/svg" viewBox="0 0 512 512" class="rfa" style="height:0.75em;fill:currentColor;position:relative;"><path d="M476 3.2L12.5 270.6c-18.1 10.4-15.8 35.6 2.2 43.2L121 358.4l287.3-253.2c5.5-4.9 13.3 2.6 8.6 8.3L176 407v80.5c0 23.6 28.5 32.9 42.5 15.8L282 426l124.6 52.2c14.2 6 30.4-2.9 33-18.2l72-432C515 7.8 493.3-6.8 476 3.2z"/></svg> a.barnett@qut.edu.au](mailto:a.barnett@qut.edu.au) --- background-image: url(figures/AcknowledgementTraditionalOwners.jpg) background-size: cover --- ## Henry Oliver Lancaster, 1913 to 2001 .pull-left[  ] .pull-right[ #### Co-founded the Statistical Society of Australia. #### HRH: "Lies, damn lies and statistics'' #### HOL: "Figures fool when fools figure" ] <!--- https://stackoverflow.com/questions/46408057/incremental-slides-do-not-work-with-a-two-column-layout ---> --- ## This talk in a nutshell  --- ## Boom in quantity <img src="lancaster_lecture_files/figure-html/unnamed-chunk-1-1.png" width="50%" style="display: block; margin: auto;" /> Data from _PubMed_. --- ## Reverse boom in quality <img src="lancaster_lecture_files/figure-html/unnamed-chunk-2-1.png" width="50%" style="display: block; margin: auto;" /> --- class:inverse, center ## Research-shaped objects <img src="https://raw.githubusercontent.com/agbarnett/talks/master/AIMOS/figures/cakes.jpg" width="100%" style="display: block; margin: auto;" /> --- ### Bad statistics is abetting weak science <!--- from ANZCTR: ---> * "Two-tailed T tests will be performed with a p value of 0.05 indicating significance." * "All statistical analysis was performed using the Graphpad Prism software.”  -- * "Many people think that all you need to do statistics is a computer and appropriate software." Doug Altman ###### [Stark and Saltelli](https://rss.onlinelibrary.wiley.com/doi/full/10.1111/j.1740-9713.2018.01174.x) "Cargo‐cult statistics and scientific crisis" _Significance_ 2018 --- class: top, center, inverse background-image: url(figures/podium.jpg) background-size: cover ### .left[Worst ever statistical methods section] -- ## .left[t-test] -- ## .right[SPSS] <!--- http://www.anzctr.org.au/Trial/Registration/TrialReview.aspx?ACTRN=12617001415392 ---> -- ## .center[SSPS] <!--- https://www.anzctr.org.au/Trial/Registration/TrialReview.aspx?id=373697 ---> --- class: top, center, inverse # Platinum medal <img src="figures/daniela.png" width="61%" style="display: block; margin: auto;" /> --- # Terrible practice ### Regression: <!--- ---> * [Only 22% of papers in medical journals reported checks of the regression model assumptions](https://ebm.bmj.com/content/24/5/185) <!--- https://peerj.com/articles/3323/ ---> * [92% of all papers using linear regression were unclear about their assumption checks](https://peerj.com/articles/3323/) ### Sample size: <!--- ---> * [Studies that explained sample size: 0%, 6% and 17%](https://www.thelancet.com/action/showPdf?pii=S0140-6736%2813%2962228-X) ### Figures: <!--- Schriger, D. L. et al. From submission to publication: A retrospective review of the tables and figures in a cohort of randomized controlled trials submitted to the british medical journal ---> * "[Less than half the figures met their data presentation potential](https://pubmed.ncbi.nlm.nih.gov/16978740/)" --- class:inverse ### Terrible plots <img src="figures/JEHP-4-101-g002.jpg" width="60%" style="display: block; margin: auto;" /> <!--- from https://www.ncbi.nlm.nih.gov/pmc/articles/PMC4946282/ ---> .pull-left[ <!--- top left 1 + 3.23 + 19.35 + 27.42 + 45.16 = 96.16, top-middle 17.74+43.55+33.87+4.34 = 99.5, bottom-right = 1.61+30.65+16.13+51.61 =100 :---> * No labels * Terrible colours and moiré patterns * Unexplained changes in size ] .pull-right[ * Numbers don't add to 100 (top-left is 96.16) * Unnecessary decimal places ] --- ## Smoothing syndrome <!--- from https://journals.plos.org/plosone/article?id=10.1371/journal.pone.0213780, 2019 paper in PLOS ONE ---> #### "Outliers were removed when the residual had a Studentized residual < -4 or > 4"  -- #### "[We continuously increased the number of animals until statistical significance was reached to support our conclusions.](https://www.nature.com/articles/s41467-017-02765-w.pdf)" --- <!--- two columns ---> .pull-left[ ## The most exciting phrase to hear in science, the one that heralds new discoveries, is not “Eureka” but “That’s funny...” Isaac Asimov (1920--1992) ] .pull-right[ <img src="https://upload.wikimedia.org/wikipedia/commons/archive/3/34/20100906191953%21Isaac.Asimov01.jpg" width="320" height="464"/> ###### Image from Wikipedia, Phillip Leonian ] --- class:inverse ### Researcher degrees of freedom <img src="figures/bayo.png" width="70%" style="display: block; margin: auto;" /> --- ### Researcher degrees of freedom <img src="https://journals.sagepub.com/na101/home/literatum/publisher/sage/journals/content/ampa/2018/ampa_1_3/2515245917747646/20181024/images/large/10.1177_2515245917747646-fig2.jpeg" width="85%" style="display: block; margin: auto;" /> ##### Silberzahn et al "Many Analysts, One Data Set: Making Transparent How Variations in Analytic Choices Affect Results" <!--- from https://journals.sagepub.com/doi/10.1177/2515245917747646 ---> --- class: inverse # Pressure for "good" results Survey of US statisticians; reported requests in last 5 years: * Removing or altering data to better support the research hypothesis = 24% * Not reporting the presence of key missing data that might bias the results = 24% * Ignoring violations of assumptions that would change results from positive to negative = 29% ###### [Wang et al](https://www.acpjournals.org/doi/10.7326/M18-1230) "Researcher Requests for Inappropriate Analysis and Reporting: A U.S. Survey of Consulting Biostatisticians" _Annals of Internal Medicine_ 2018 <!--- Algorithm that leaves out every single observation and re-calculates p-value ---> --- ## P-values <img src="figures/zwet.jpg" width="72%" style="display: block; margin: auto;" /> From "[The Significance Filter, the Winner's Curse and the Need to Shrink](https://arxiv.org/abs/2009.09440)" <!--- * All scientific thinking gets defenestrated as soon as clinicians see the p-value ---> --- ## P-values <img src="figures/kareem_carr_tweet.png" width="58%" style="display: block; margin: auto;" /> --- ## Bad practice gives good results <img src="https://raw.githubusercontent.com/agbarnett/talks/master/waste/figures/journal.pbio.3000246.g001.PNG" width="60%" style="display: block; margin: auto;" /> ###### [Allen and Mehler](https://journals.plos.org/plosbiology/article?id=10.1371/journal.pbio.3000246) (2019) "Open science challenges, benefits and tips in early career and beyond" _PLOS Biology_ --- class:inverse ## Terrible incentives  From Paulina Stehlik et al, available at [BMJ opinion](https://blogs.bmj.com/bmj/2020/07/14/specialist-college-training-a-potential-source-of-research-wastage/) -- ## Also ... * Cash rewards and promotions based on publication counts * Need to focus on competence not excellence --- # The clever country? .pull-left[  ] .pull-right[ <!--- from AMSI ---> * Less than one in four Australian Year 7 to 10 students have a qualified maths teacher * 7% of Year 12 girls took advanced maths in 2017 compared to 12% of boys * Gutting of maths/stats at Murdoch * Threatened closure of ANU statistical consultancy unit ] --- ## Support for good statistics #### "The Statistical Crisis in Science" [Andrew Gelman](https://www.americanscientist.org/article/the-statistical-crisis-in-science) #### "Areas where researcher competence is critical [...] study statistics and analysis" [NHMRC report](https://www.nhmrc.gov.au/research-policy/research-quality-steering-committee) #### "Biostatistics: a fundamental discipline at the core of modern health data science" [MJA paper](https://www.mja.com.au/journal/2019/211/10/biostatistics-fundamental-discipline-core-modern-health-data-science) --- class:inverse ## Support from colleagues? .pull-left[ <!--- confused ---> <img src="https://media.giphy.com/media/3o6YglDndxKdCNw7q8/giphy.gif" width="80%" style="display: block; margin: auto;" /> ] .pull-right[ Citation to our MJA paper: “P value is considered significant when its value equal or less than 0.05(18).” ] --- class:inverse # Imaginative support .pull-left[ <!--- https://twitter.com/ChelseaParlett/status/1367985904237776899?s=20 ---> <img src="figures/Chelsea1.png" width="90%" style="display: block; margin: auto;" /> ] .pull-right[ <!--- https://twitter.com/ChelseaParlett/status/1366113557377523713 ---> <img src="figures/Chelsea2.png" width="90%" style="display: block; margin: auto;" /> ] --- class:center, middle #Automation  --- ## Impressive example of automation <img src="figures/journal.pbio.3001107.g001.PNG" width="48%" style="display: block; margin: auto;" /> Serghiou et al "[Assessment of transparency indicators across the biomedical literature: How open is open](https://journals.plos.org/plosbiology/article?id=10.1371/journal.pbio.3001107)" --- # What can we check? * Numerical errors in text and tables, e.g.,: “10/20 (55%)” * P-values and confidence intervals. Checks for inconsistencies and errors * Sample size calculations. Checks of whether the sample size can be reproduced * Linear and logistic regression models. Checks of whether appropriate model assumptions have been verified * Missing data. Checks to detect missing data in the results that have not been mentioned in the methods * Fraudulant data, groups in randomised trials that are too similar --- # What more can we check? * Outcome switching by comparing the protocol and published paper * Qualitative guidance on interpreting p-values * Poorly designed figures * Citation manipulation * Flag citations to retracted papers --- class: inverse, center # Removing bad papers once they are published ...  --- class: inverse, center, middle # We need to change the conversation about statistics in health and medical research -- ### “Most scientists today are devoid of ideas, full of fear, intent on producing some paltry result so that they can contribute to the flood of inane papers that now constitutes ‘scientific progress’ in many areas” Paul Feyerabend, 1975 -- ### “Poor quality publications won’t change the world, they won’t add to knowledge, they won’t lead to improvements in the length or quality of our lives” - NHMRC CEO Professor Anne Kelso, 2019 --- class:center  [https://github.com/Lee-V-Jones/statistical-quality](https://github.com/Lee-V-Jones/statistical-quality) **Review just five papers**