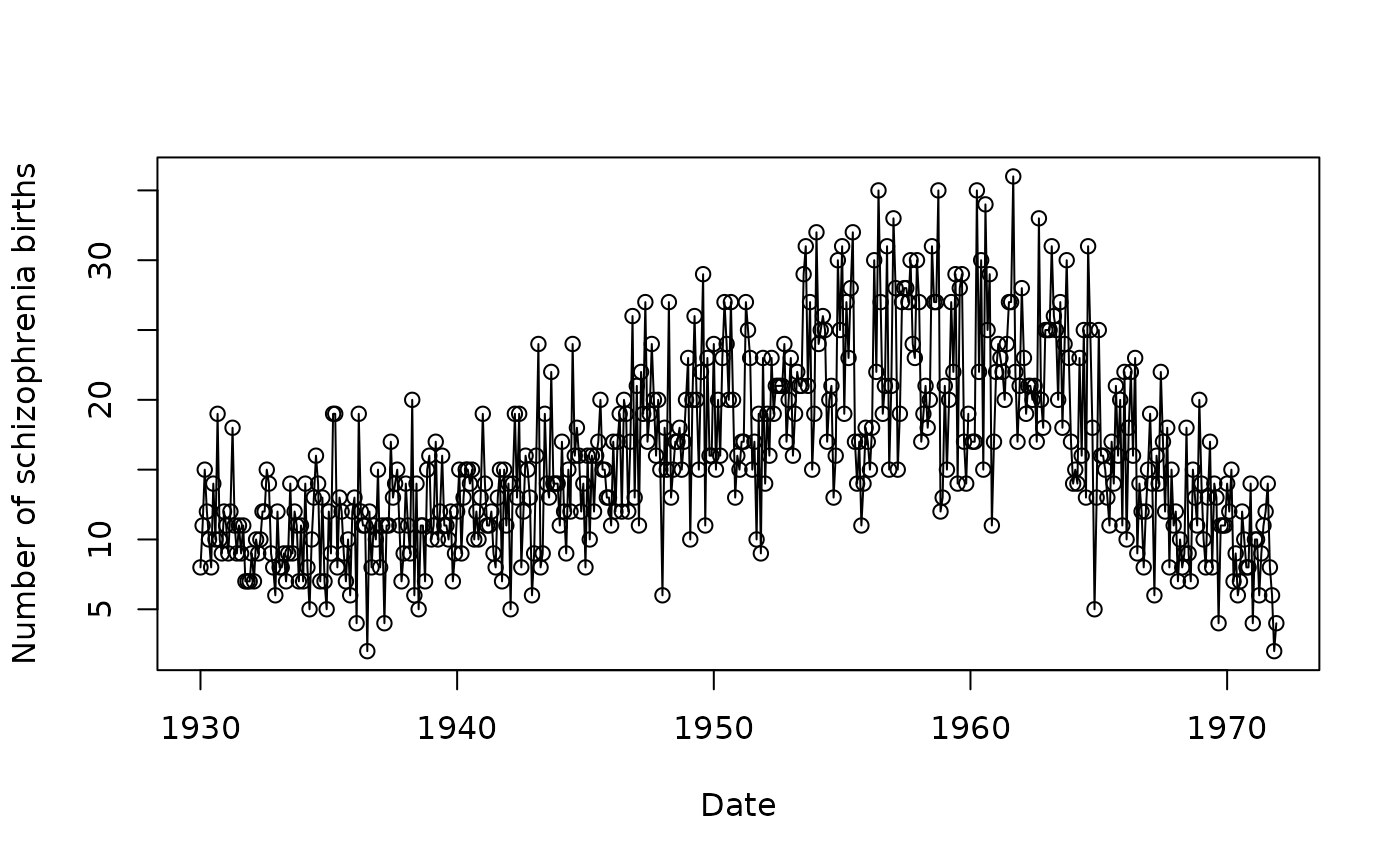
Monthly number of babies born with schizophrenia in Australia from 1930 to 1971. The national number of births and number of cases are missing for January 1960 are missing.
Format
A data frame with 504 observations on the following 6 variables:
year: year of birth
month: month of birth
yrmon: a combination of year and month: \(year+(month-1)/12\)
NBirths: monthly number of births in Australia, used as an offset
SczBroad: monthly number of schizophrenia births using the broad diagnostic criteria
SOI: southern oscillation index
Examples
plot(
  schz$yrmon,
  schz$SczBroad,
  type = 'o',
  xlab = 'Date',
  ylab = 'Number of schizophrenia births'
)