Plots results by month. Assumes the data frame contains variables called
year and month. Faceted or coloured line plot of a monthly response over
time. Assumes the data frame contains year and month columns.
See also
plotMonth() (deprecated wrapper)
Examples
# \donttest{
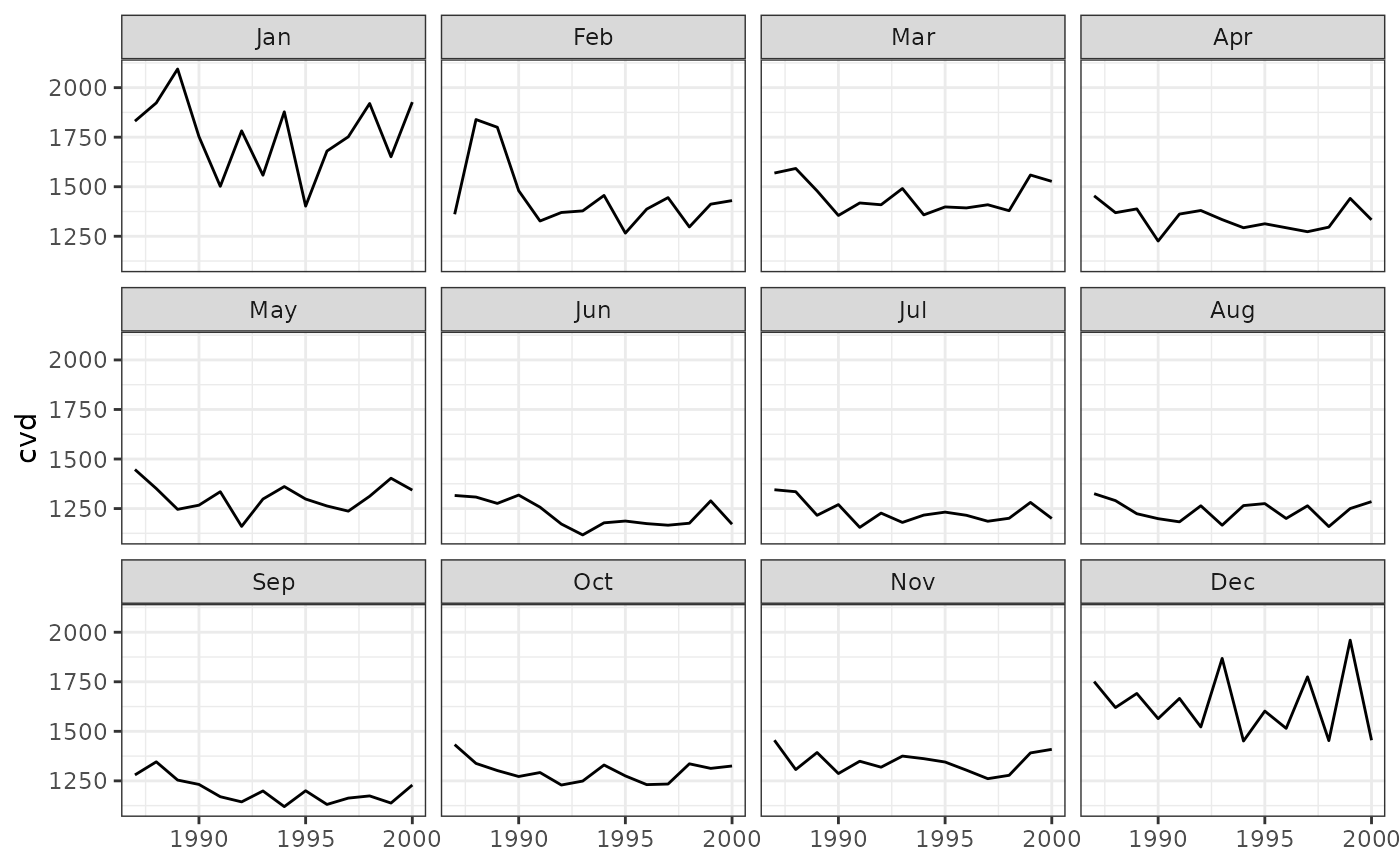
plot_month(data = CVD, resp = "cvd", panels = 12)
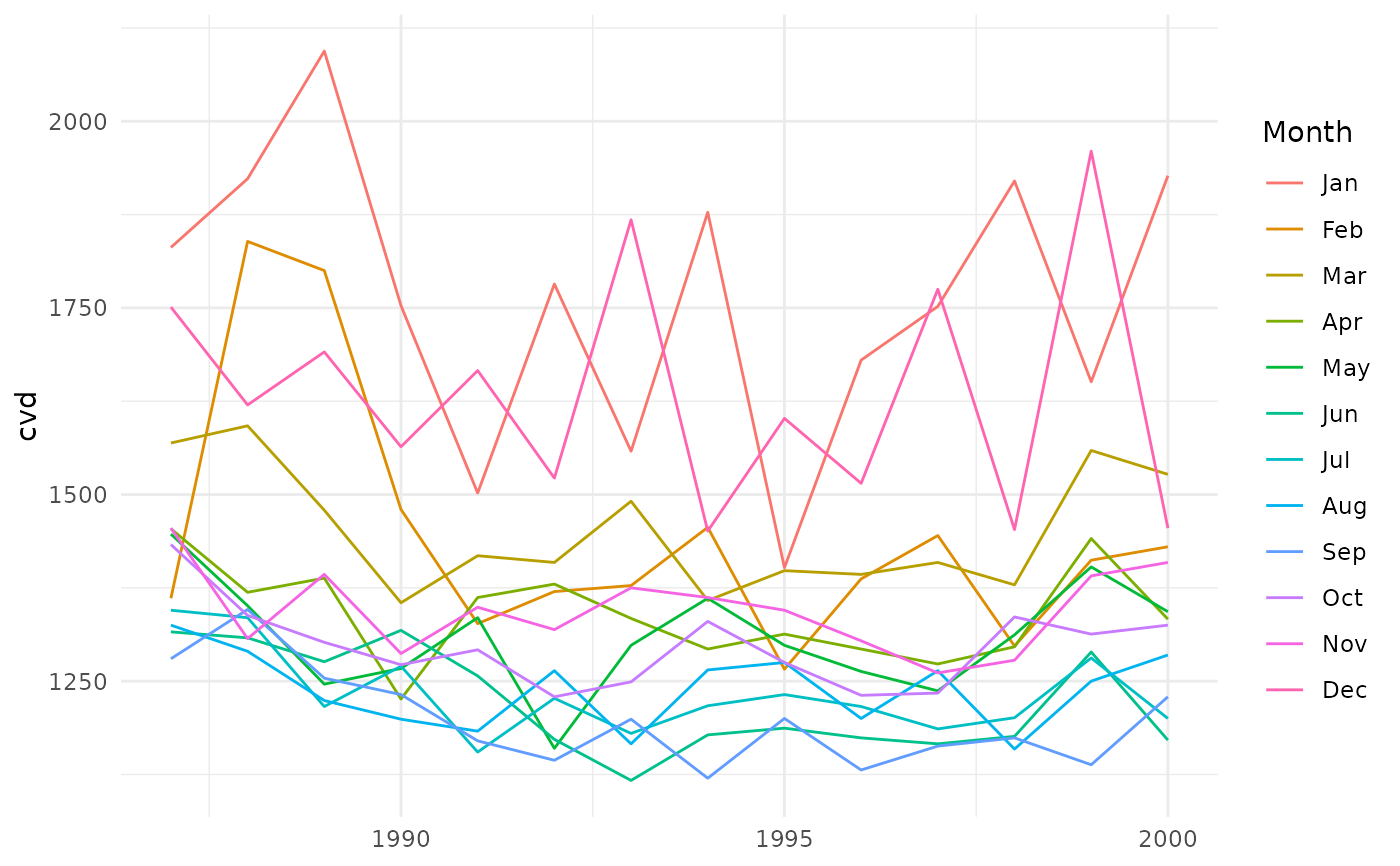
 plot_month(data = CVD, resp = "cvd", panels = 1) +
ggplot2::theme_minimal()
plot_month(data = CVD, resp = "cvd", panels = 1) +
ggplot2::theme_minimal()
 # }
# }