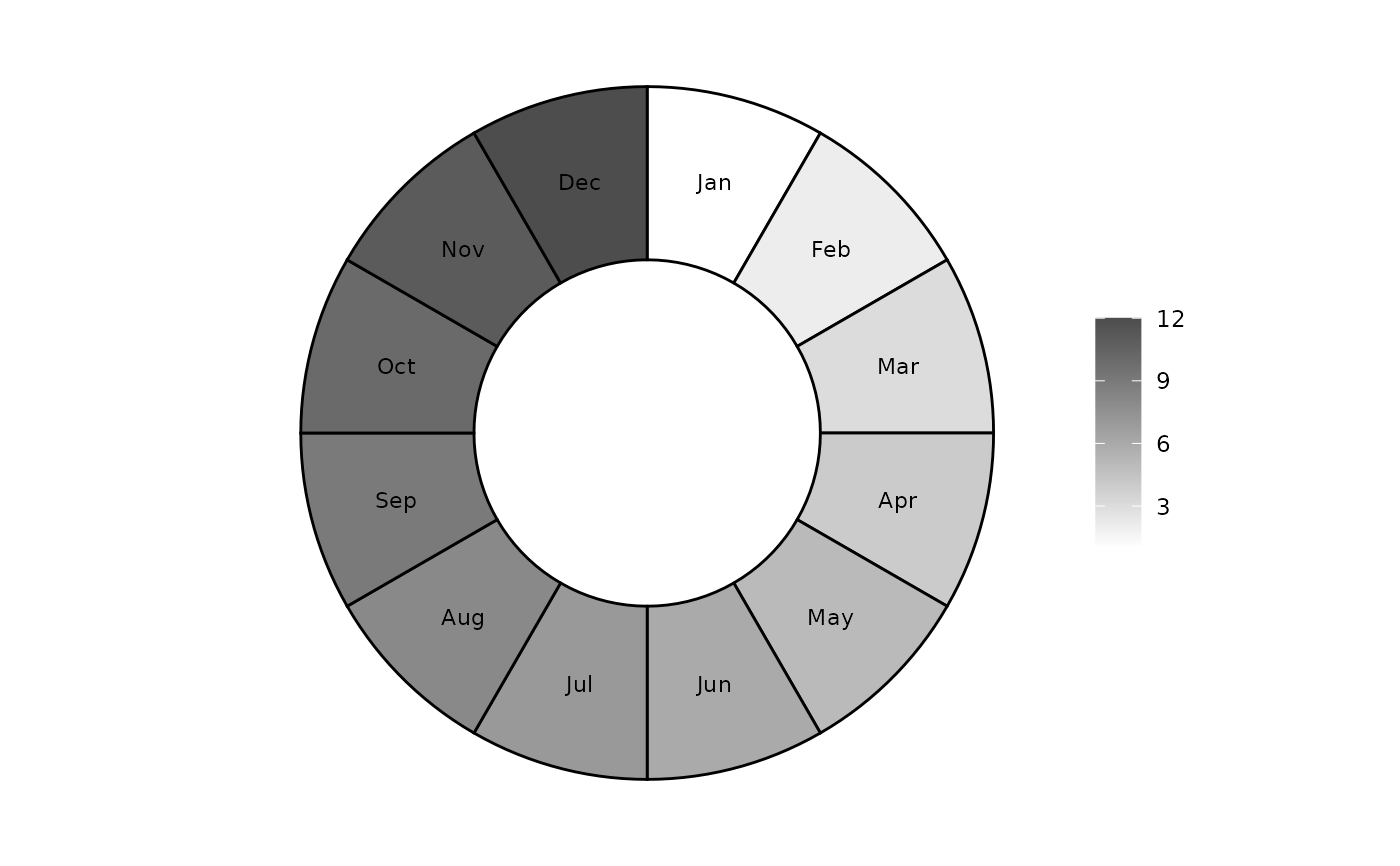
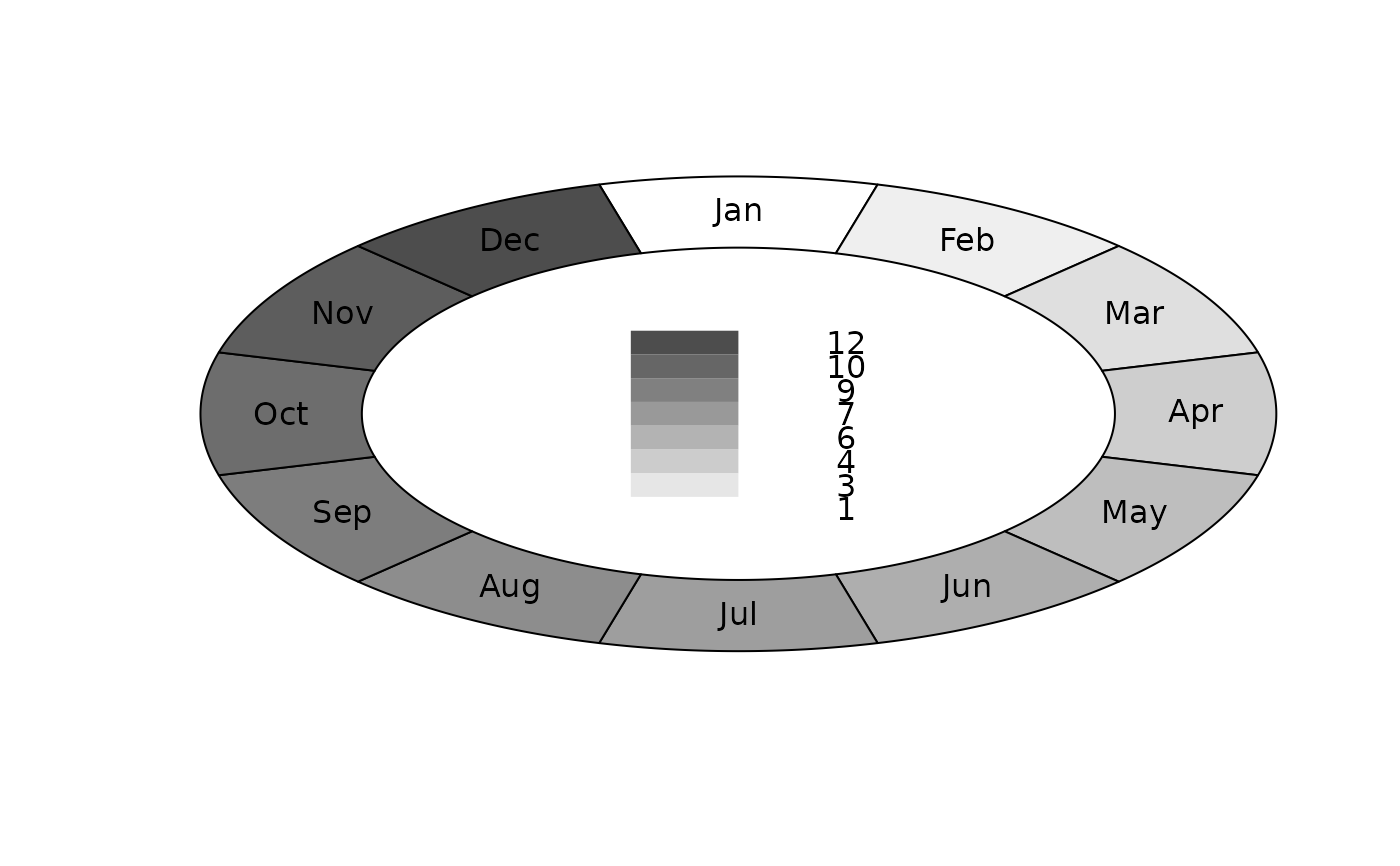
Circular plot of a monthly variable. This circular plot can be useful for estimates of an annual seasonal pattern. Darker shades of grey correspond to larger numbers.
Arguments
- months
monthly variable to plot, the shades of grey of the 12 segments are proportional to this variable. The first result is assumed to be January, the second February, and so on.
- dp
decimal places for statistics, default=1.
- ...
additional arguments to
plot()
Details
![[Deprecated]](figures/lifecycle-deprecated.svg) Soft-deprecated in favour of
Soft-deprecated in favour of
plot_circle(), which returns a ggplot object you can extend with +.
The base R plot below still works.
Author
Adrian Barnett a.barnett@qut.edu.au
Examples
# \donttest{
# Recommended:
plot_circle(months = seq(1, 12, 1), dp = 0)
 # Still works, but deprecated:
plotCircle(months = seq(1, 12, 1), dp = 0)
#> Warning: `plotCircle()` was deprecated in season 0.3.17.
#> ℹ Please use `plot_circle()` instead.
# Still works, but deprecated:
plotCircle(months = seq(1, 12, 1), dp = 0)
#> Warning: `plotCircle()` was deprecated in season 0.3.17.
#> ℹ Please use `plot_circle()` instead.
 # }
# }