![[Deprecated]](figures/lifecycle-deprecated.svg) Soft-deprecated in favour of
Soft-deprecated in favour of
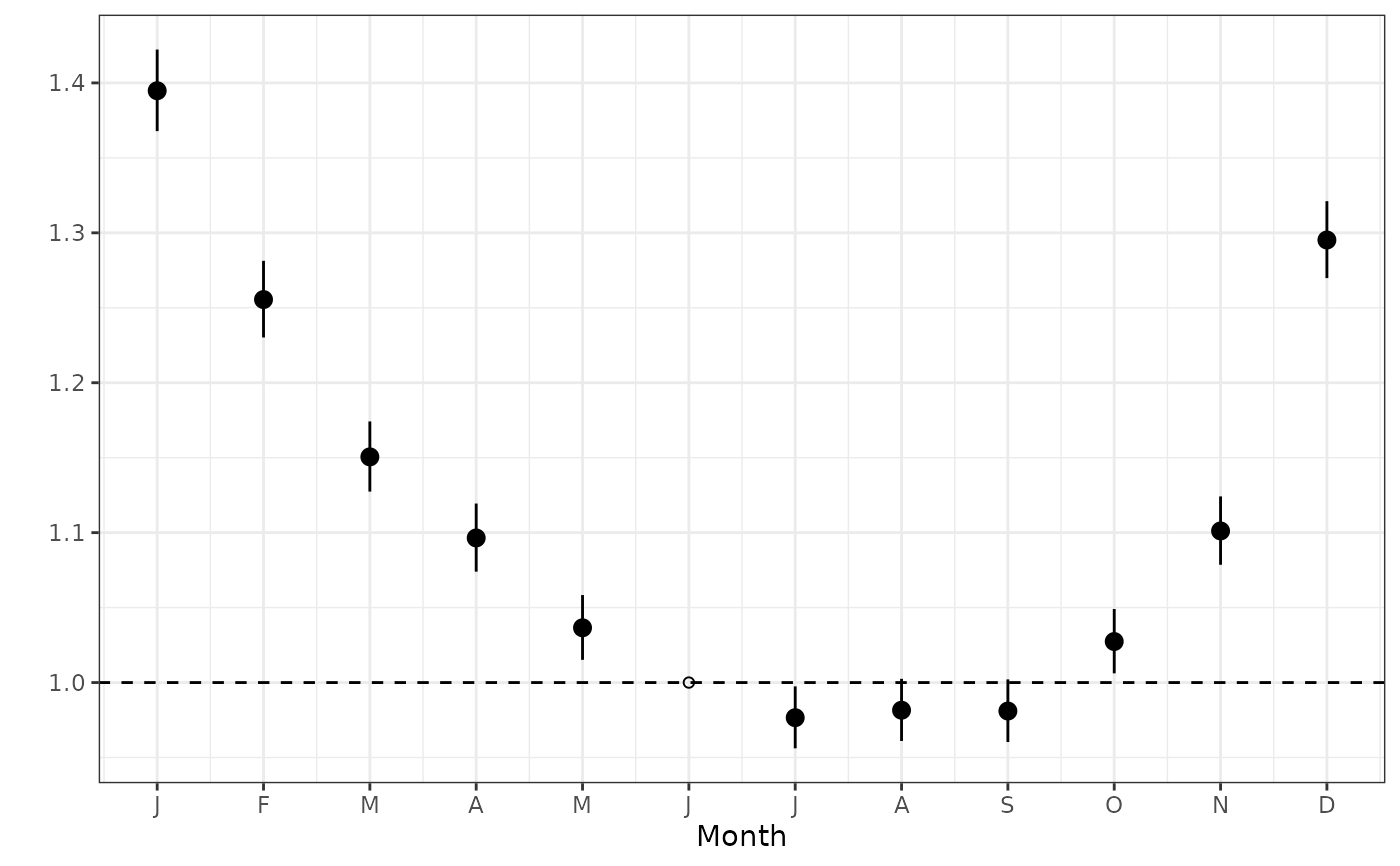
autoplot.monthglm(), which returns a ggplot object. The base R plot()
will still work, but we recommend using autoplot.monthglm().
Usage
# S3 method for class 'monthglm'
plot(x, alpha = 0.05, ylim = NULL, xlab = "", ylab = "", ...)
Arguments
- x
a
monthglmobject produced bymonthglm().- alpha
statistical significance level of confidence intervals.
- ylim
y coordinates ranges (the default is NULL, and the limits are automatically calculated).
- xlab, ylab
x and y labels. Defaults is no label: "".
- ...
additional arguments passed to
plot().
Author
Adrian Barnett a.barnett@qut.edu.au
Examples
# \donttest{
mmodel <- monthglm(
formula = cvd ~ 1,
data = CVD,
family = poisson(),
offsetpop = expression(pop / 100000),
offsetmonth = TRUE,
refmonth = 6
)
# Recommended:
autoplot(mmodel)
 # Still works, but deprecated:
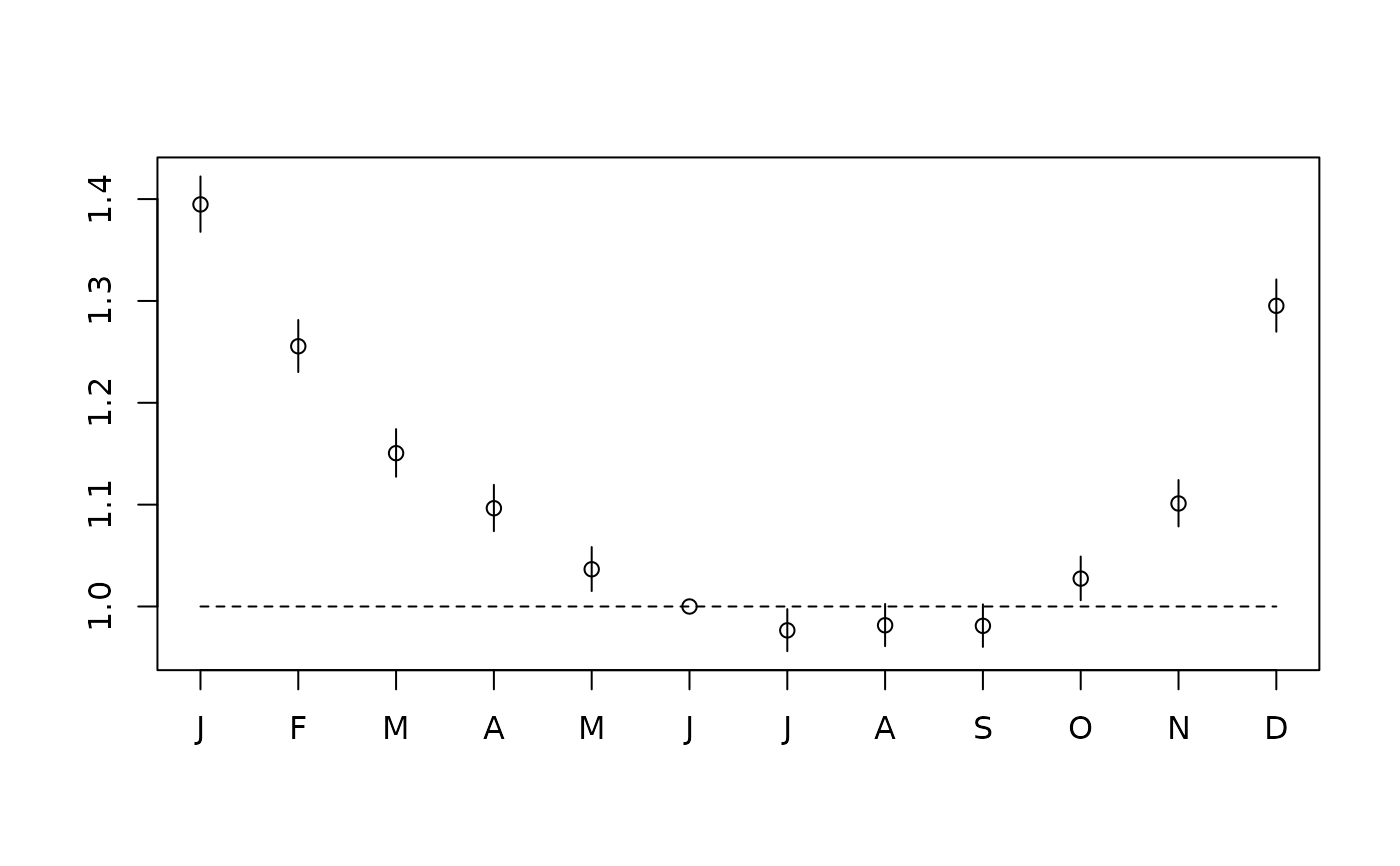
plot(mmodel)
#> Warning: `plot.monthglm()` was deprecated in season 0.3.17.
#> Use `autoplot()` for a ggplot object you can extend:
#> ℹ autoplot(x) + ggplot2::labs(x = ..., y = ...)
# Still works, but deprecated:
plot(mmodel)
#> Warning: `plot.monthglm()` was deprecated in season 0.3.17.
#> Use `autoplot()` for a ggplot object you can extend:
#> ℹ autoplot(x) + ggplot2::labs(x = ..., y = ...)
 # }
# }