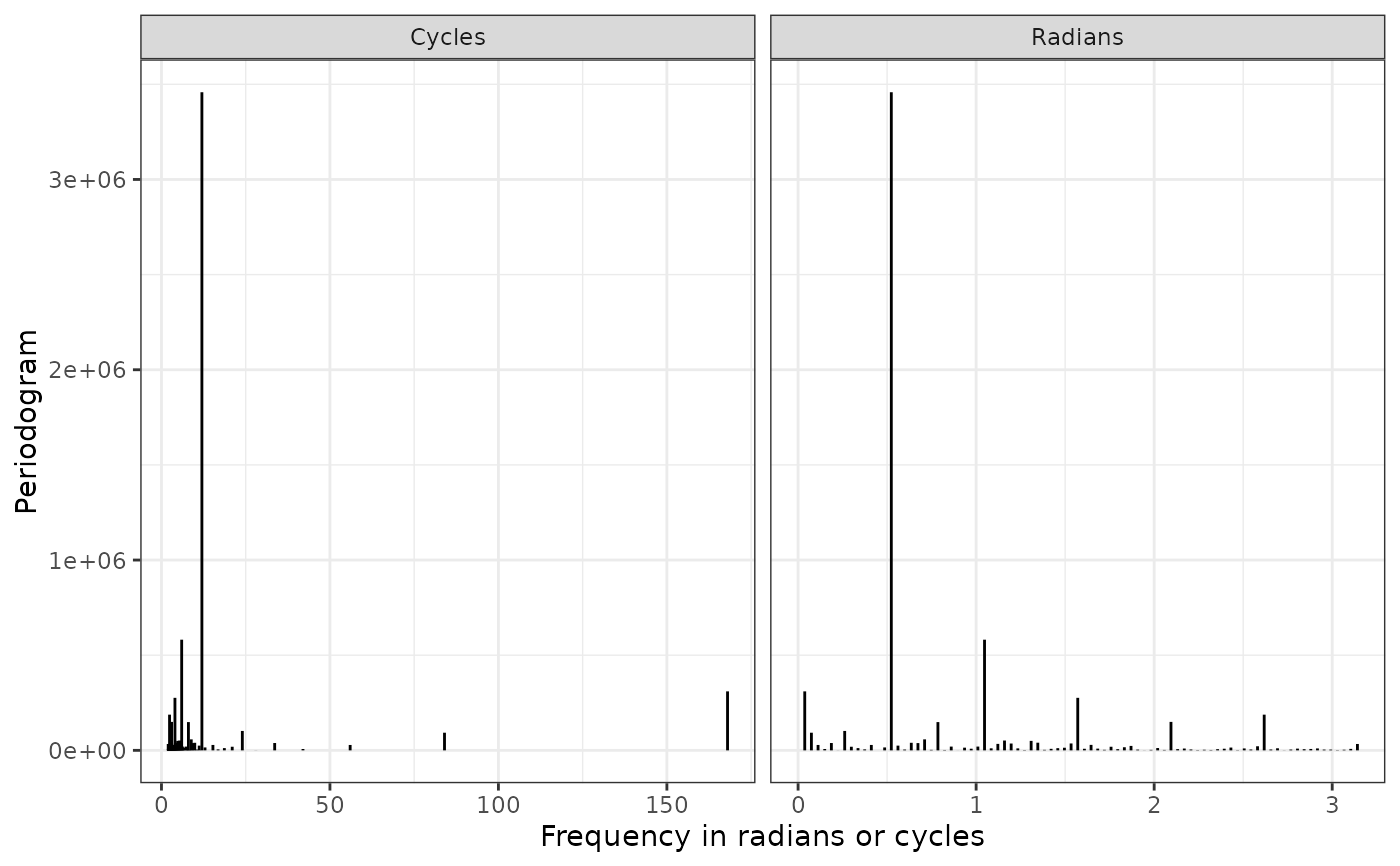
Estimated periodogram using the fast Fourier transform (fft).
Usage
peri(data, adjmean = TRUE, plot = lifecycle::deprecated())Arguments
- data
a data frame.
- adjmean
subtract the mean from the series before calculating the periodogram (default=TRUE).
- plot
![[Deprecated]](figures/lifecycle-deprecated.svg) Use
Use autoplot.peri()on the returned object instead.
Value
an object of class "peri" (a tibble) with the columns:
peri: periodogram, I(\(\omega\)).
freq_radians: frequencies in radians, \(\omega\).
freq_cycles: frequencies in cycles of time, \(2\pi/\omega\).
amp: amplitude periodogram.
phase: phase periodogram.
Pass the result to autoplot() to draw the plot.
Author
Adrian Barnett a.barnett@qut.edu.au
Examples
# \donttest{
p <- peri(CVD$cvd)
autoplot(p)

# }
# }