For time series recorded at monthly intervals it is often useful to examine (and plot) the average in each month. When using count data we should adjust the mean to account for the unequal number of days in the month (e.g., 31 in January and 28 or 29 in February).
Usage
monthmean(
  data,
  resp,
  offsetpop = NULL,
  adjmonth = c("none", "thirty", "average")
)
Arguments
- data
Data frame with variables "month" and "year"
- resp
Response variable in data for which the means will be calculated.
- offsetpop
optional population, used as an offset (default=NULL).
- adjmonth
adjust monthly counts and scale to a 30 day month ("thirty") or the average month length ("average") (default="none").
Value
Returns an object of class "Monthmean" with the following parts:
mean: a vector of length 12 with the monthly means.
Details
This function assumes that the data set (data) contains variables for
the year and month called year and month, respectively.
References
Barnett, A.G., Dobson, A.J. (2010) Analysing Seasonal Health Data. Springer. doi:10.1007/978-3-642-10748-1
Author
Adrian Barnett a.barnett@qut.edu.au
Examples
# \donttest{
# cardiovascular disease data
mmean <- monthmean(
data=CVD,
resp='cvd',
offsetpop = expression(pop/100000),
adjmonth = 'average'
)
#> Total number of days: 5114
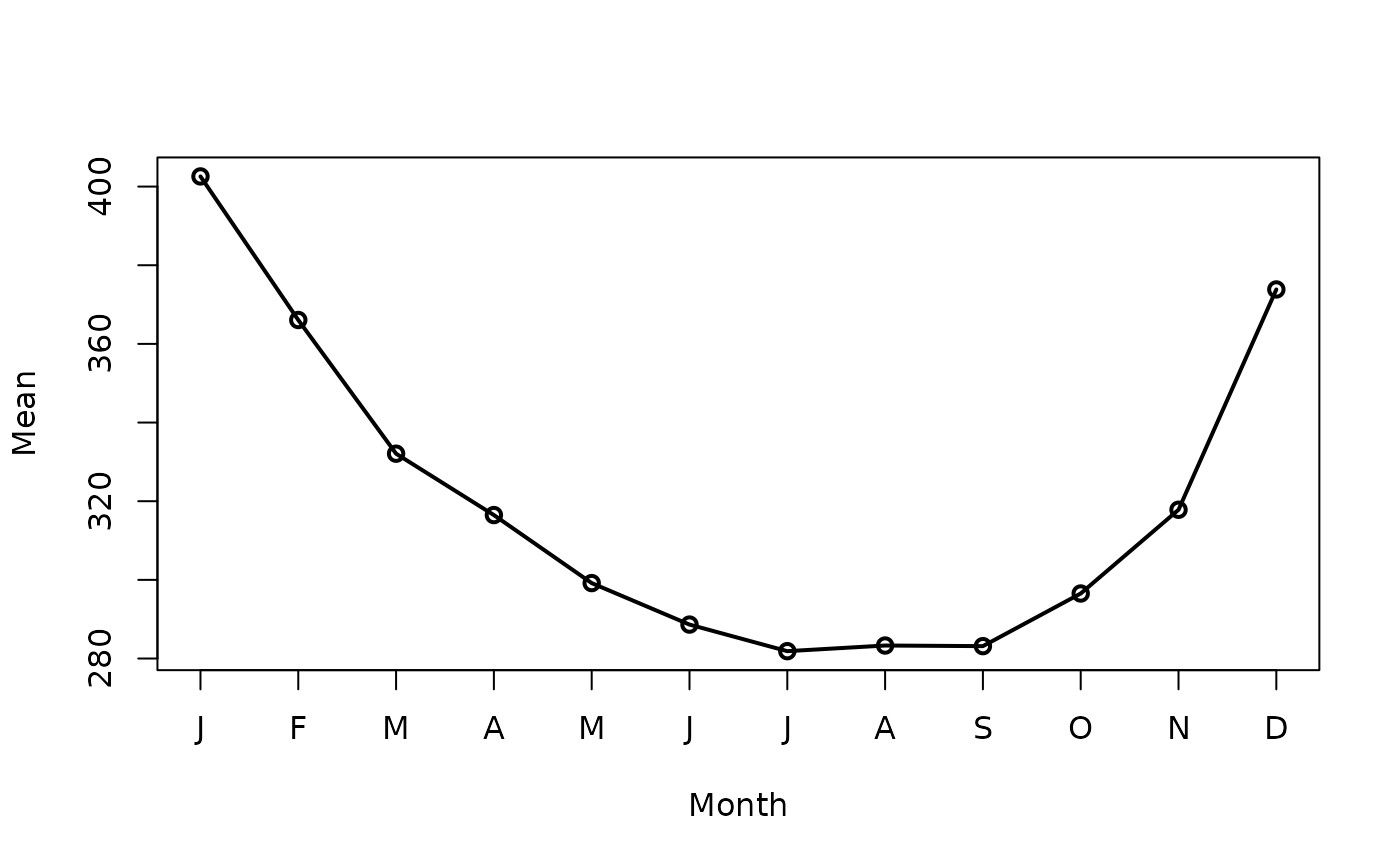
mmean
#> Month Mean
#> January 402.6
#> February 366.1
#> March 332.1
#> April 316.5
#> May 299.2
#> June 288.6
#> July 281.9
#> August 283.3
#> September 283.1
#> October 296.5
#> November 317.8
#> December 373.8
plot(mmean)
#> Warning: `plot.Monthmean()` was deprecated in season 0.3.17.
#> Use `autoplot()` for a ggplot object you can extend:
#> ℹ autoplot(x) + ggplot2::theme_bw()
 mmean <- monthmean(
data=CVD,
resp='cvd',
offsetpop = expression(pop/100000),
adjmonth = 'thirty'
)
#> Total number of days: 5114
# }
mmean <- monthmean(
data=CVD,
resp='cvd',
offsetpop = expression(pop/100000),
adjmonth = 'thirty'
)
#> Total number of days: 5114
# }