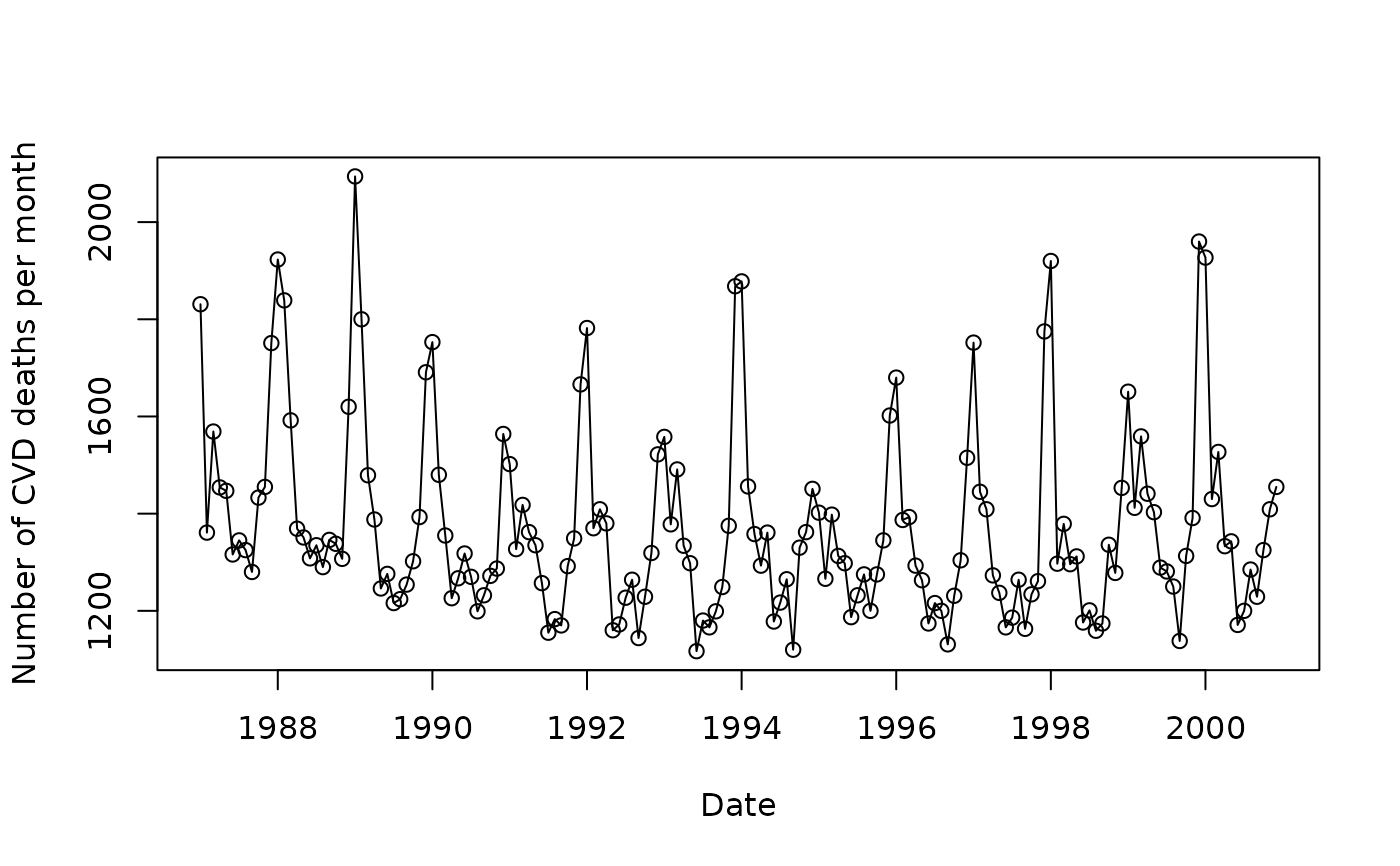
Monthly number of deaths from cardiovascular disease in people aged 75 and over in Los Angeles for the years 1987 to 2000.
Format
A data frame with 168 observations on the following 8 variables:
year: year of death
month: month of death
yrmon: a combination of year and month: \(year+(month-1)/12\)
cvd: monthly number of CVD deaths
tmpd: mean monthly temperature (degrees Fahrenheit)
pop: Los Angeles population aged 75+ in the year 2000 (this value is constant as only one year was available, but in general the population will change over time)
ndaysmonth: number of days in each month (used as an offset)
adj: adjusted number of CVD deaths per month using a standardised month length. Monthly number of CVD deaths multiplied by (365.25/12)/ndaysmonth. So the standard month length is 30.4 days.
References
Samet JM, Dominici F, Zeger SL, Schwartz J, Dockery DW (2000). The National Morbidity, Mortality, and Air Pollution Study, Part I: Methods and Methodologic Issues. Research Report 94, Health Effects Institute, Cambridge MA.
Examples
plot(
  CVD$yrmon,
  CVD$cvd,
  type = 'o',
  xlab = 'Date',
  ylab = 'Number of CVD deaths per month'
  )